Activities
Deepen your understanding of Visualizing Data with these carefully crafted educational exercises that let you get the most out of this TED Studies subject.
Activity 1
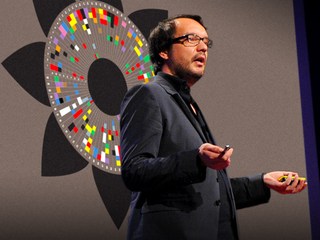
Watch Nic Marks's TEDTalk "The Happy Planet Index". Marks argues that when we measure only economic indicators such as GDP, we are focusing on the wrong things. What does Marks think we should be measuring? How are these things related? How does he use data visualization to make his point? In his main graph, what should we be focusing on for the countries shown in the bottom left? What should we be focusing on for the countries in the top right? Consider Marks alongside Hans Rosling, comparing the messages they share about the relative well-being of the world's nations and the data visualization tools they use to make their points.
Activity 2
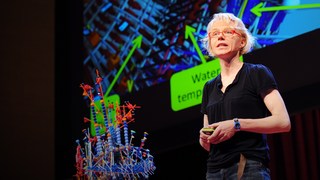
Watch this NOAA video on CO2 levels in the atmosphere. This powerful visual representation of data starts out only showing a small piece of the full graph. Why do you think the designers created it this way? Can you think of other ways the designers might have displayed this data? How might Nathalie Miebach have represented this scientific data?
Activity 3
"Exploring Climate and Development Links" from the World Bank shows excellent visualization of predicted temperature and precipitation changes over the next century under different scenarios. Look at projected temperature changes and projected precipitation changes under both scenarios. Be sure to scroll around on the map to find your own region. Why do you think the designers chose the colors that they did? Do you find the colors effective? When you click on the map, an overlaid graph appears. What does this graph show?
Activity 4
Watch the CDC's animated demonstration on trends in obesity levels in the United States. You'll need to scroll down to the bottom of the page to find the graphic labeled "Percent of Obese (BMI ≥ 30) in U.S. Adults." The animation shows how obesity rates have changed over the period from 1985 to 2010. Be sure to watch the entire thing: Stop the animation and use the previous button to scroll it back to 1985 and play it from the start. Do you find the data visualization effective? Does this animation catch your eye and stay with you more than reading a paragraph describing the obesity epidemic in the U.S.? Discuss the use of color in this data visualization. Do you find the colors effective? Would you change anything in the design of this data visualization? How might David McCandless or Chris Jordan have represented this data?
Activity 5
Read the blog post "How Governments Can Better Use Data Visualization" by economist and data visualization creator Jon Schwabish. In his blog post, Schwabish shares five examples of poor graphical representations of data. Pick two of the five to analyze. In each case: Describe why Schwabish believes the graph is not effective. Do you agree with his assessment? Discuss ways in which the data might have been presented in a more effective way.
Activity 6
The webcomic xkcd.com includes movie narrative charts that illustrate character interactions over space and time. These include charts for the Lord of the Rings trilogy, the original Star Wars trilogy, Jurassic Park, 12 Angry Men, and Primer. What do you think about presenting the information this way? Explain why the charts for the last two movies 12 Angry Men and Primer are not as interesting as the first two. (You might have to look up a summary of each movie if you're not familiar with one or both.) Name another movie for which you think this method would be interesting and effective. This space/time illustration for movies might remind you of the visualization method used by Deb Roy. How are they similar?
Activity 7
The"Many Eyes" project sponsored by IBM includes lots of interesting data visualizations and has features that let users create their own visualizations based on a vast array of contributed datasets at the site or by uploading their own data. You can search by keyword for data that interests you and choose from an assortment of visualization methods to create and modify displays within the site. Give it a try! You can publish a visualization you create to the site, submit comments on those already there — and maybe someone else will comment on yours.
Activity 8
Google Fusion Tables is an application that allows you to combine your own data with other data on the web, collaborating with other users, visualizing the data and sharing it via Google Drive. Google provides excellent tutorials on creating data visualizations and the application also points users to many public data sources. Pick one of the data sources and create your own data visualization.